
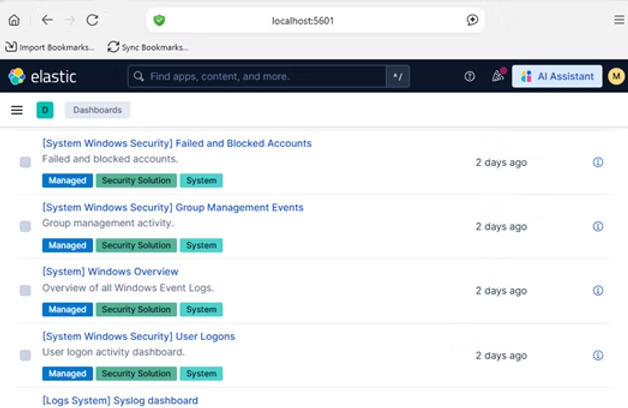
After successfully implementing log collection and visualization using Kibana, the next phase of my project focused on building a custom real-time SOC dashboard.
The goal was to move beyond static analysis and create a system capable of live monitoring, detection, and visualization of security events.
Project Objective
The main objective was to design a dashboard that can:
- Detect brute force attacks in real time
- Visualize attacker behavior using dynamic charts
- Continuously update without manual refresh
- Simulate a real-world Security Operations Center (SOC) environment
System Architecture
The solution is built on a three-layer architecture:
- Elasticsearch → Stores and indexes Windows security logs
- Node.js (Express API) → Processes detection logic and exposes endpoints
- Frontend (HTML + Chart.js) → Displays alerts and attack visualizations
Detection Engine
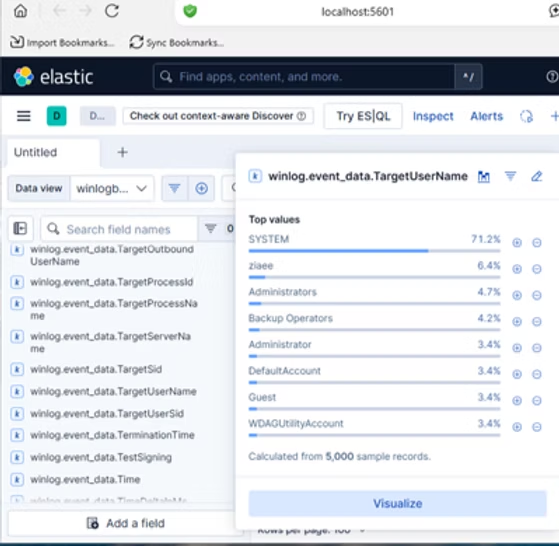
The backend analyzes Windows Security Events, specifically:
- event.code: 4625 → Failed login attempts
Using aggregation and filtering logic, the system identifies:
- High-frequency login failures
- Suspicious user behavior
- Top attackers (based on username or IP)
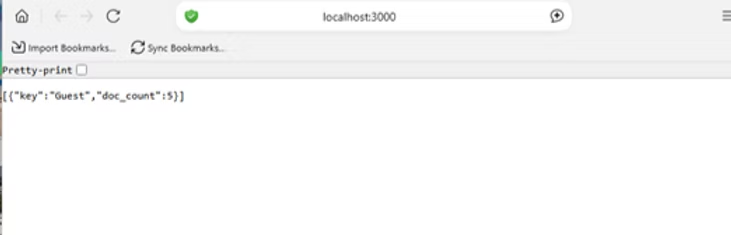
Example Detection Output
{
  "username": "Guest",
  "attempts": 5,
  "alert": "Brute Force Detected"
}
RELATED POSTS
View all