
In this phase of the project, I focused on collecting, visualizing, and understanding Windows security logs using the Elastic Stack (Elasticsearch, Kibana, and Winlogbeat).
Log Collection with Winlogbeat
The first step was to configure Winlogbeat on a Windows machine to collect system and security logs.
These logs were then forwarded to Elasticsearch, where they were indexed and made searchable.
After setup, I verified the data ingestion by querying Elasticsearch:
- Index: winlogbeat-*
- Example event: event.code: 4625 (Failed login attempts)
Exploring Logs in Kibana
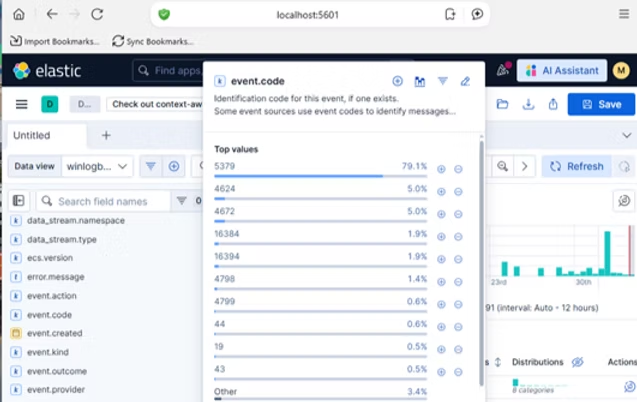
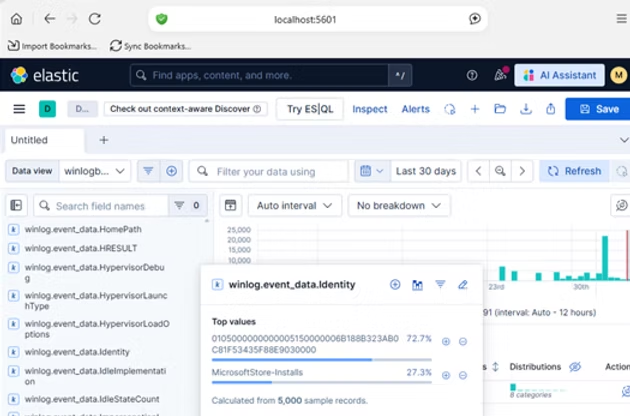
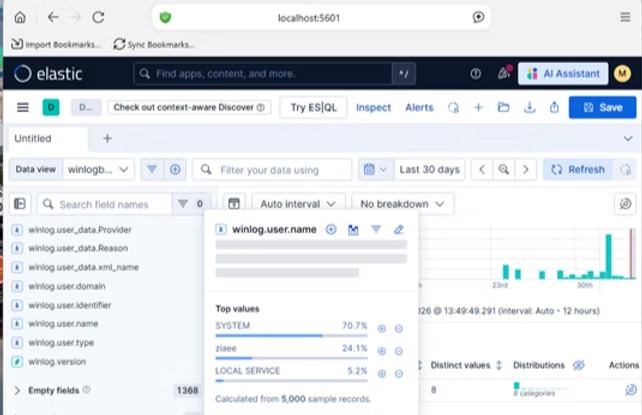
Using Kibana’s Discover tab, I was able to:
- Search logs using filters (e.g., event.code: 4625)
- Inspect structured fields like:
- Validate that logs were correctly parsed and indexed
This step was crucial to ensure data quality before moving into analysis.
Creating Visualizations
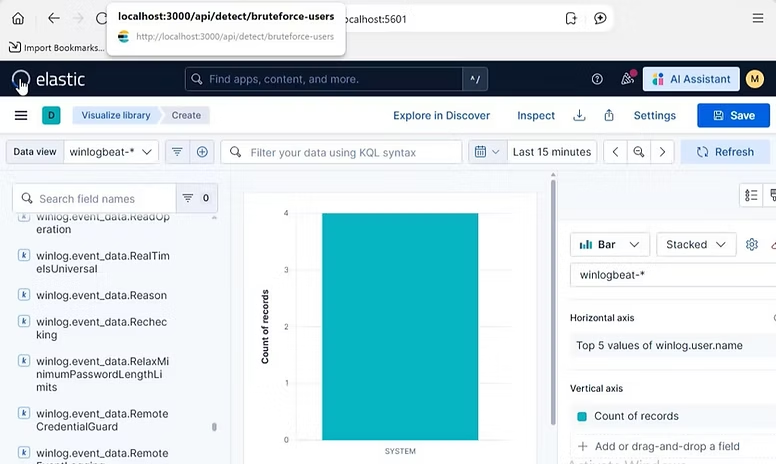
Once the data was verified, I moved to Kibana Visualize Library to build meaningful visualizations.
Example Visualization: Failed Login Attempts by User
- Chart Type: Bar Chart
- X-Axis: user.name.keyword (Top users)
- Y-Axis: Count of events
This helped identify which users had the highest number of failed login attempts.
Dashboard Creation
After building individual visualizations, I combined them into a dashboard to monitor activity more efficiently.
The dashboard included:
- Failed login attempts per user
- Event distribution over time
- Host-level activity insights
This provided a centralized view of system activity and potential security events.
Challenges Faced
During this phase, I encountered a few common issues:
- Some fields (e.g., IP address) did not contain data in certain logs
- Incorrect time range filtering resulted in empty visualizations
- Field mapping differences (e.g., keyword usage) affected aggregation
Resolving these issues improved my understanding of how Elasticsearch stores and structures data.
Key Takeaways
- Understanding field mappings is essential for building accurate visualizations
- Time filtering plays a critical role in log analysis
- Kibana is powerful for exploration, but requires clean and structured data
- Event codes (like 4625) are key to detecting security-related behavior
Next Steps
With the visualization layer complete, the next phase focuses on:
- Building a custom backend using Node.js
- Creating detection logic (e.g., brute force detection)
- Connecting Elasticsearch data to a custom application dashboard
This phase laid the foundation for moving from log collection → visualization → detection & automation.
RELATED POSTS
View all