
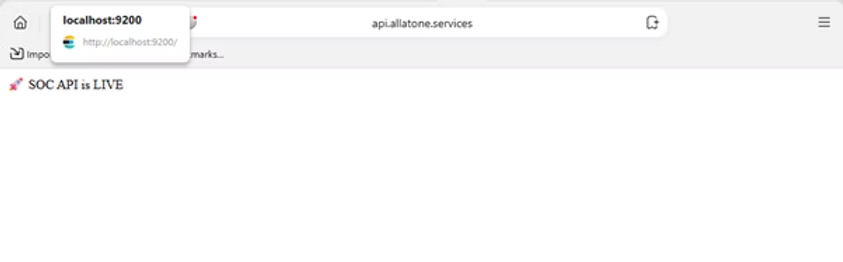
I just deployed my first SOC (Security Operations Center) backend to a live VPS and exposed it via a domain.
Stack:
- Node.js (Express API)
- Elasticsearch (Winlogbeat logs)
- Nginx (reverse proxy)
- PM2 (process manager)
What I built:
- Detection APIs for failed logins (Event ID 4625)
- Aggregations for top attackers (IP / username)
- Timeline analysis for brute-force patterns
- Alerting via Telegram & Email
Real challenges I faced (and solved):
- Elasticsearch 401 authentication issues
- PM2 vs manual Node process conflicts
- Nginx 502 / connection refused errors
- “Cannot GET /” → missing root route
- HTTP 500 → caused by unhandled ES failures
- Empty results → due to wrong event codes (4624 vs 4625)
- Missing attacker IPs → logs were local (IpAddress = “-“)
Key lessons: A working backend is not enough — real SOC systems depend heavily on data quality and log context.
🌐 Live API:http://api.mydomain
Debugging a SOC Pipeline: What Broke and Why
Building detection logic is one thing. Making it work in production is another.
Here are the real issues I hit while building my SOC API:
❌ Problem 1: Empty detection results👉 Cause: I was querying Event ID 4625, but only had 4624 (successful logins)
❌ Problem 2: Top attacker IPs were empty👉 Cause: All logs had IpAddress = “-” (local logins, not remote attacks)
❌ Problem 3: HTTP 500 on root route👉 Cause: Elasticsearch errors not handled properly (no fallback)
❌ Problem 4: “Cannot GET /”👉 Cause: Missing root endpoint
❌ Problem 5: Nginx 502 / refused connection👉 Cause: backend not reachable or wrong proxy config
❌ Problem 6: Syntax errors (must_not)👉 Cause: wrong Elasticsearch query structure (not inside a bool)
What I learned:
- Detection ≠ Code → Detection = Code + Data + Context
- Always wrap ES queries in try/catch
- Always return safe fallback (res.json([]))
- Validate your logs before building logic
Biggest insight: If your logs are wrong, your SOC is blind.
RELATED POSTS
View all